Pulsatile Hemodynamics & Womersley Flow Simulation
Numerical and analytical resolution of the unsteady Navier-Stokes equations for oscillatory blood flow in rigid cylindrical geometries. Evaluates how the Womersley dimensionless number (α = R√(ω/ν)) governs the transition from classical parabolic Poiseuille flow to blunted plug flow and high-frequency annular velocity overshoot (Richardson annular effect), validated against benchtop pulsatile flow experimental tracking.
Dynamic Velocity Profile Monitor • u(r, t)
Real-time solution of the unsteady momentum equation. Observe smooth profile morphing and wall shear deceleration across pulsatile cardiac phases.
Fluid Mechanics: Transient Inertia vs. Viscous Shear
In cardiovascular hemodynamics, the heart drives flow via an oscillatory pressure gradient. The Womersley number (α) is the square root of the ratio between oscillatory inertial forces and viscous forces. It dictates how deeply wall friction penetrates into the vascular lumen over one cardiac cycle.
When α is small (< 2), momentum diffuses across the entire radius in a fraction of a cycle, preserving the classic parabolic Poiseuille shape. When α > 10, the core fluid has too much inertia to respond synchronously to the pressure gradient, compressing viscous dissipation into a thin Stokes boundary layer of thickness δ ∼ R/α.
Because Bessel functions of complex arguments introduce real and imaginary components, the resulting velocity u(r, t) undergoes a continuous phase lag across the radius. Near the vessel wall, low inertia allows the fluid to reverse direction almost immediately when the pressure gradient inverts, while the core continues gliding forward.
Computational Pipeline & Experimental Validation
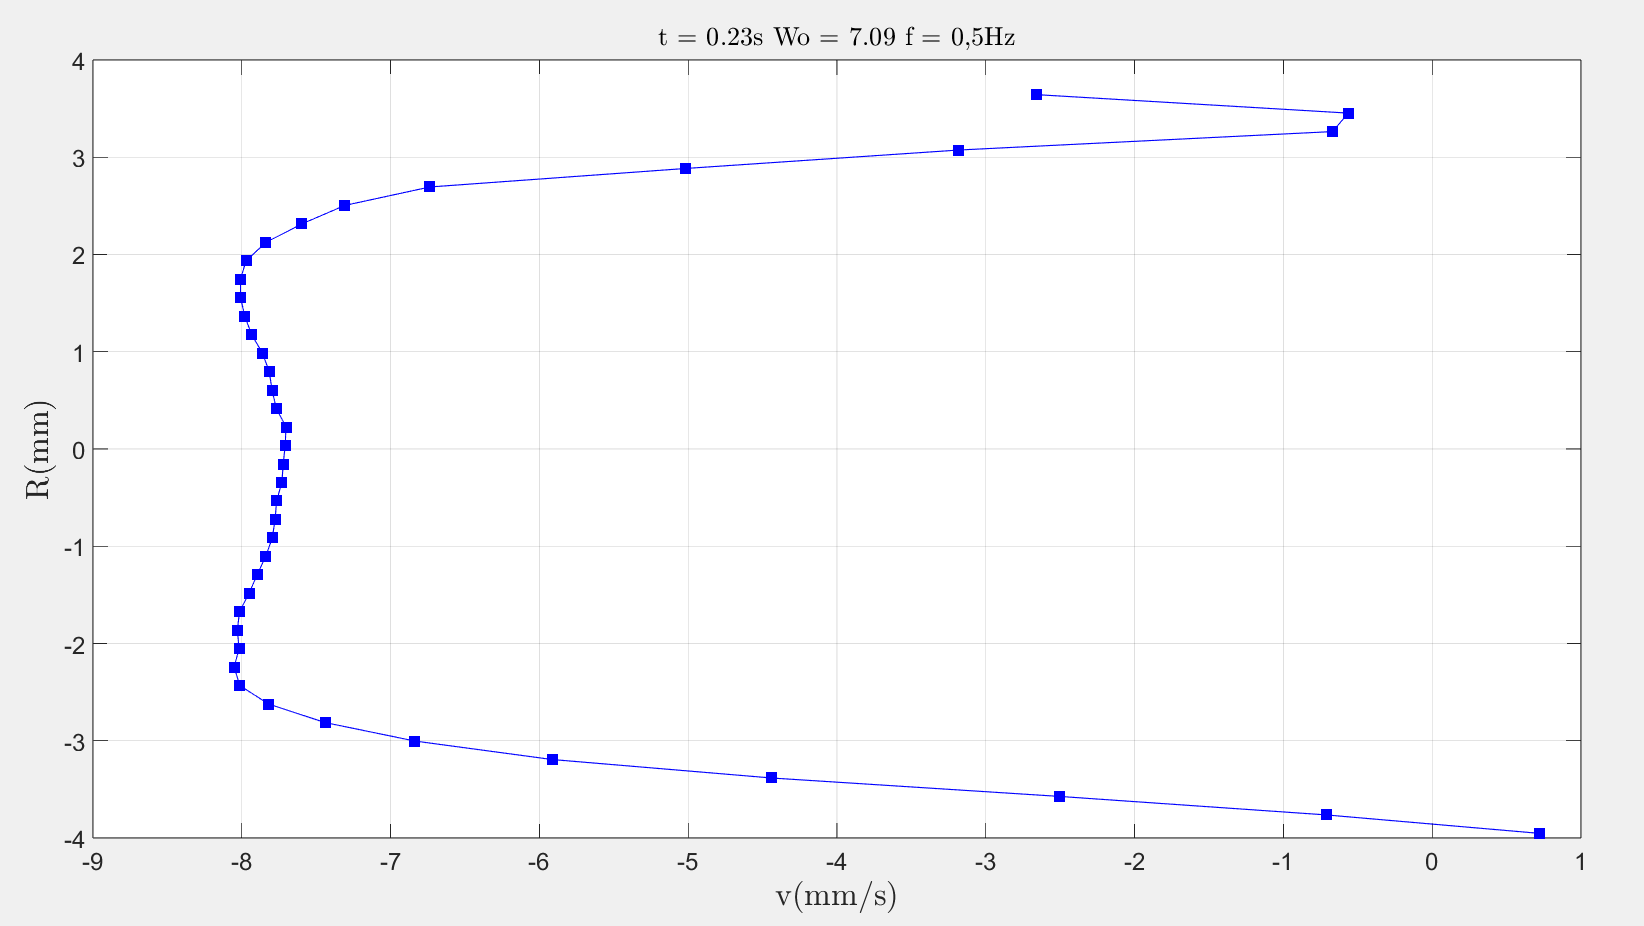
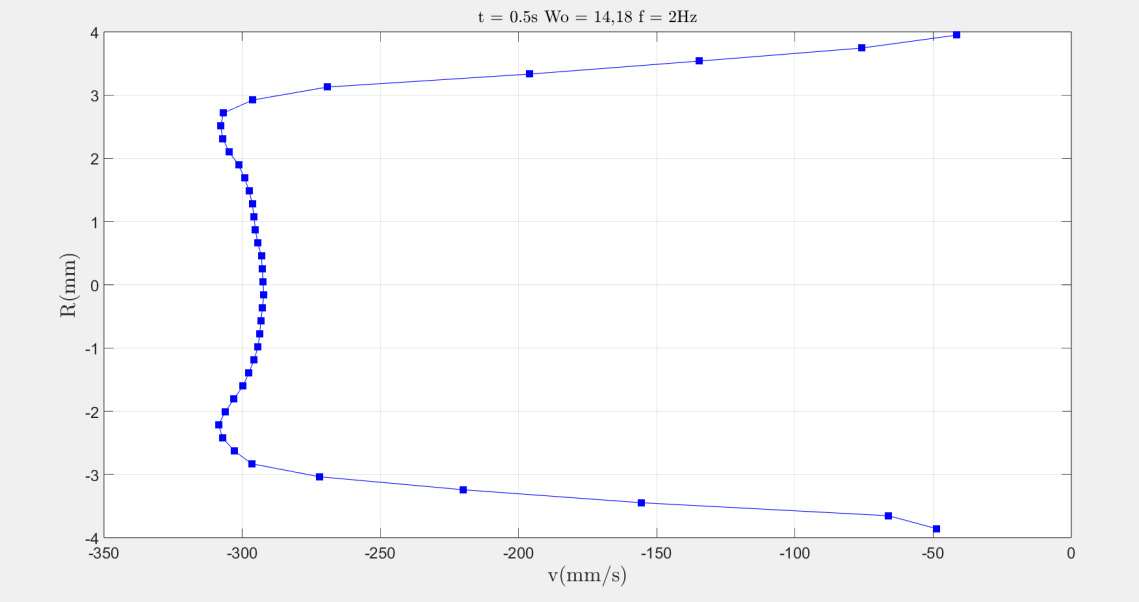
Resolution of the Womersley differential system in MATLAB using complex Bessel evaluation (besselj), compared directly against experimental particle tracking in physical pulsatile flow channels.
Physical Pulsatile Channel Tracking vs. Numerical Profiles
Wall Shear Stress τw(t) Over Cardiac Cycle
MATLAB AnalyticalStokes Boundary Layer Thickness δ/R vs α
δ ∼ R / αCenterline Phase Lag φcenter vs α
Phase RetardationOscillatory Flow Rate Attenuation |Q| / |QPoiseuille|
Impedance DampingMorphological & Hemodynamic Characterization
Womersley Number Spectrum • Theoretical Values
Analytical Reference| Womersley α | Center Value u(0) | Peak Value u_max | Peak Location r/R | Profile Curvature & Morphology | Anatomical Site |
|---|---|---|---|---|---|
| 1.0 | 1.00 | 1.00 | 0.00 (Center) | Convex parabolic (Poiseuille) | Terminal arterioles |
| 4.0 | 0.88 | 0.88 | 0.00 (Center) | Convex arch with broader shoulders | Radial / Tibial arteries |
| 7.0 | 0.755 | 0.755 | 0.00 (Center) | Plug-like: gentle plateau, rounded flanks | Femoral / Brachial arteries |
| 14.0 | 0.645 | 0.760 | ±0.76 | Concave center bowl, twin rounded lobes | Common Carotid artery |
| 20.0 | 0.525 | 0.890 | ±0.84 | Full M-profile (Richardson annular overshoot) | Ascending Aorta (resting/exercise) |
Translational Significance in Vascular Biomechanics
Atherogenesis & Endothelial Shear Stress
The Richardson annular effect causes early flow deceleration and boundary layer reversal near the vessel wall while the core still moves forward. This creates low and oscillatory wall shear stress (OSI > 0.3), the proven mechanical trigger for focal atheromatous plaque formation in the carotid bifurcation.
Accuracy Limits of Poiseuille Assumptions
Clinical Doppler ultrasound algorithms that presume a parabolic Poiseuille velocity profile severely overestimate peak systolic volumetric flow in large conduits (α > 7) by up to 35%, proving the clinical necessity of Womersley correction filters in diagnostic hemodynamics.
Experimental Rig Validation
Physical benchtop tracking of tracer particles confirmed the exact numerical Bessel solution, demonstrating that non-dimensional Womersley scaling accurately predicts unsteady physiological velocity fields without requiring full 3D CFD discretization in straight conduits.