Non-Invasive Cardiovascular Hemodynamics & Electromechanical Profiling
A synchronized dual-channel investigation coupling thoracic Lead II electrocardiography (ECG) with digital infrared photoplethysmography (PPG). Quantified electromechanical pre-ejection latency, autonomic vasomotor thermoregulation, and age-dependent arterial stiffening across lifespan cohorts (ages 9–86) using pulse contour analysis and the Moens-Korteweg hydrodynamic formulation.
Synchronized Bio-Signal Monitor (ECG Lead II + Peripheral PPG)
Real-time visualization of myocardial electrical depolarization synchronized with digital infrared volumetric pulse arrival.
Data Acquisition (DAQ) & Sensor Telemetry
Biopotential recording in physiology labs is frequently contaminated by skeletal muscle motion artifacts and 60 Hz power-line interference. The experimental setup utilized the wireless iWorx TA-ROAM telemetry biopotential unit docked on an iWorx TA acquisition chassis, combined with an infrared transmission plethysmograph (PPG-320) on the finger.
Electrode Configuration (Modified Lead II)
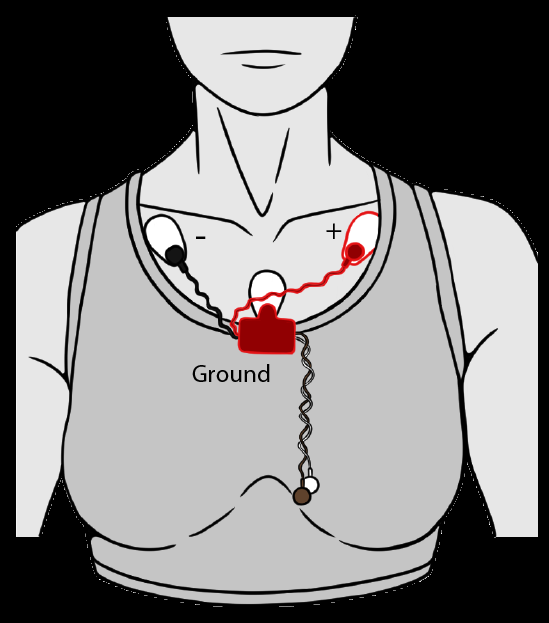
3-lead thoracic montage: Infraclavicular $(-)$, Left lower rib $(+)$, Sternal ground.
1. Thoracic Vector Orientation
The positive lead $(+)$ was placed on the left anterior chest below the pectoralis major and the negative lead $(-)$ at the right subclavicular fossa. This approximates the anatomical mean electrical axis of ventricular depolarization (Einthoven Lead II), maximizing the signal-to-noise ratio of the R-wave peak.
2. Optical Photoplethysmography (PPG-320)
Fastened with velcro to the volar aspect of the distal segment of the left middle finger. It illuminates dermal capillary beds with near-infrared light and detects transmitted photodiode current, registering local blood volume expansions synchronously with central aortic ejections.
3. Signal Conditioning & Pre-Processing
Hardware bandpass filtering (0.05 Hz high-pass to eliminate respiration baseline wander, 100 Hz low-pass to eliminate high-frequency EMG noise) with an active 60 Hz notch filter. A continuous mathematical pulse integral transform was applied in LabScribe to reconstruct smooth pressure-analog volume pulses.
Vasomotor Autonomic Reactivity: Thermal Stress Profiling
To characterize autonomic vascular regulation, the subject's left forearm was subjected to targeted acute localized cooling (ice water cold pressor) followed by rewarming and localized hyperthermia (heat pack). Pulse contour and propagation timing were logged continuously.
Experimental Thermal Response Dataset (Subject 1: 20-yr Young Adult)
Empirical DAQ Telemetry| Condition | R-R Interval | Heart Rate | R-Pulse Latency | Systolic Amplitude | Physiological Mechanism |
|---|---|---|---|---|---|
| Pre-Test Baseline | 0.860 s | 71 bpm | 0.170 s | 1.604 mV | Normothermic baseline |
| Cold Pressor (1 min) | 0.865 s | 68 bpm | 0.275 s | 0.119 mV | Sympathetic vasoconstriction |
| Cold Pressor (2 min) | 0.790 s | 77 bpm | 0.260 s | 0.184 mV | Sustained thermal defense |
| Rewarming (1 min) | 0.815 s | 75 bpm | 0.235 s | 1.330 mV | Reactive hyperemic rebound |
| Rewarming (2 min) | 0.855 s | 71 bpm | 0.195 s | 1.560 mV | Hemodynamic stabilization |
| Local Heat (2 min) | 0.698 s | 86 bpm | 0.145 s | 1.950 mV | Arteriolar vasodilation |
Arterial Aging: Stiffness Index (SI) & Moens-Korteweg Modeling
Arterial compliance ($\Delta V / \Delta P$) acts as a hydraulic buffer (Windkessel effect), converting pulsatile left ventricular outflow into steady capillary perfusion. With aging, elastic fiber fragmentation and advanced glycation end-product (AGE) cross-linking of collagen elevate vessel wall stiffness. We quantified these alterations across four age groups using digital volume pulse contour analysis.
Estimates large artery pulse wave velocity by normalizing subject height over the transit time between forward and reflected waves.
Measures peripheral vascular tone. High RI indicates marked peripheral vasoconstriction; low RI reflects vascular relaxation.
Direct index of myocardial oxygen consumption (MVO2) and cardiac workload under differing vascular afterload.
• Critical Engineering Insight: Why R-Pulse Interval ≠ Pure Pulse Wave Velocity (PWV)
Although the ECG R-wave marks ventricular depolarization and the PPG wave detects peripheral pulse arrival, their difference (R-Pulse interval) cannot be used directly as PWV. The interval incorporates the pre-ejection period (PEP, 50–80 ms) — the isovolumetric contraction time required for intraventricular pressure to exceed aortic pressure before the aortic valve leaflets open. True PWV requires differential measurement between two arterial transit points ($\Delta D / \Delta t$) or pulse contour reflection time analysis.
Cross-Sectional Lifespan Dataset & Cardiovascular Indices
JNC VI Classification| Cohort Subject | Age | Height | Stiffness Index (SI) | Reflection Index (RI) | Blood Pressure | Heart Rate | RPP Workload | BP Status |
|---|---|---|---|---|---|---|---|---|
| Subject 1 (Young Adult) | 20 | 1.56 m | 5.61 m/s | 38.63% | 95.8 / 60.9 | 69 bpm | 6,608 | Optimal |
| Subject 2 (Pediatric Female) | 9 | 1.27 m | 7.74 m/s | 33.68% | 82.5 / 60.0 | 77 bpm | 6,349 | Hypotensive |
| Subject 3 (Middle-Aged Male) | 52 | 1.85 m | 7.81 m/s | 15.08% | 115.7 / 73.6 | 65 bpm | 7,519 | Optimal |
| Subject 4 (Geriatric Male) | 86 | 1.83 m | 12.80 m/s | 38.42% | 130.8 / 82.8 | 64 bpm | 8,370 | Prehypertensive |
Experimental Figures & Matplotlib Analytics
Publication-ready figures generated from lab data illustrating the biophysical relationships between vascular stiffness, age progression, and myocardial demand.
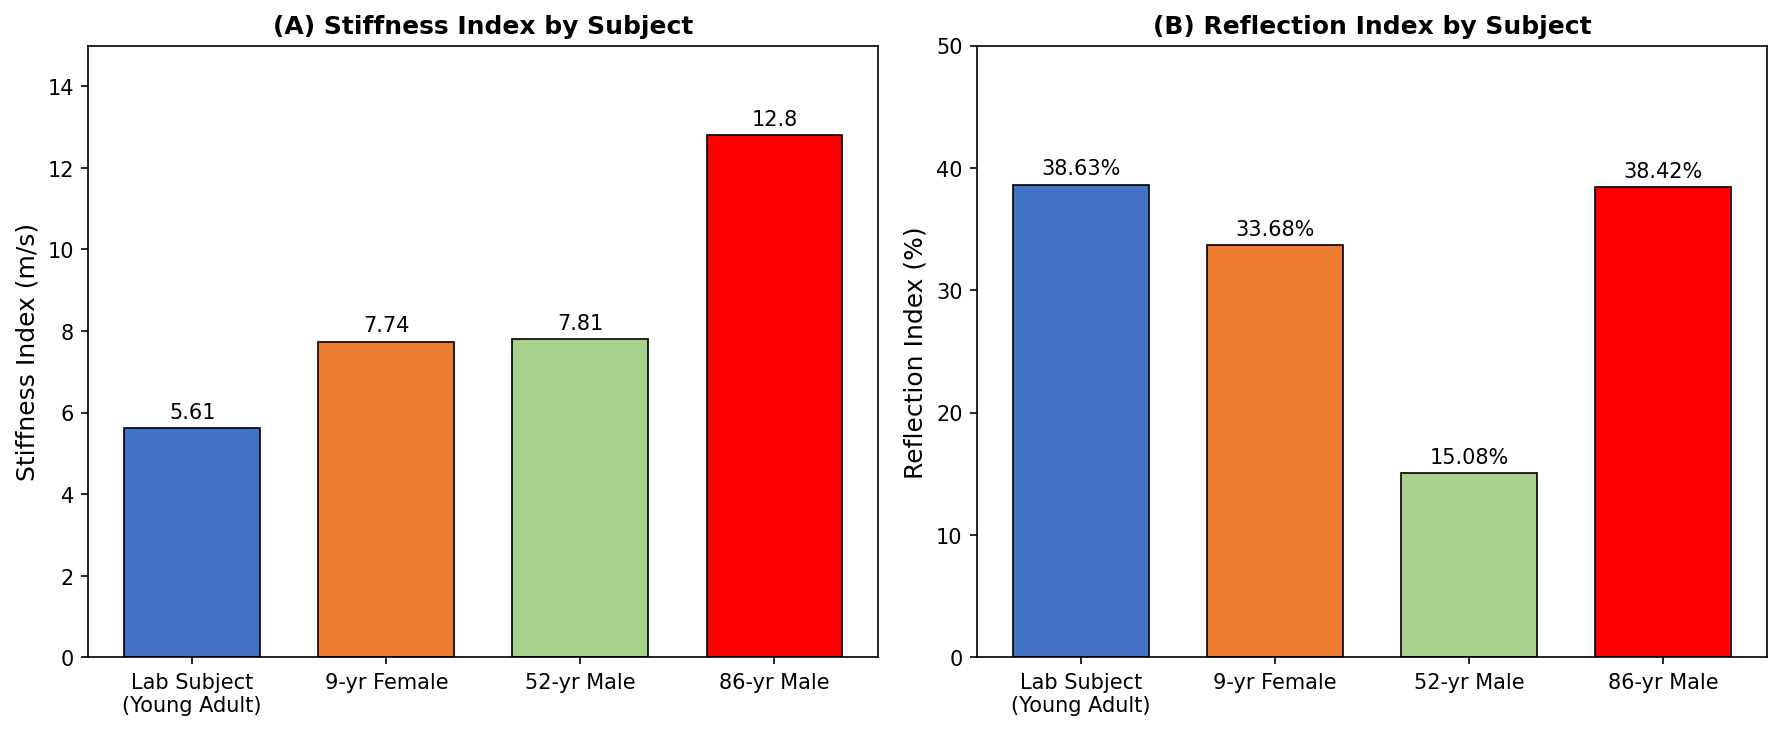
Stiffness Index (A) vs. Reflection Index (B)
SI demonstrates a pronounced upward trajectory with chronological age (5.61 m/s → 12.80 m/s), whereas RI exhibits non-monotonic behavior, highlighting that structural wall stiffness and real-time vasomotor tone are physiologically decoupled.
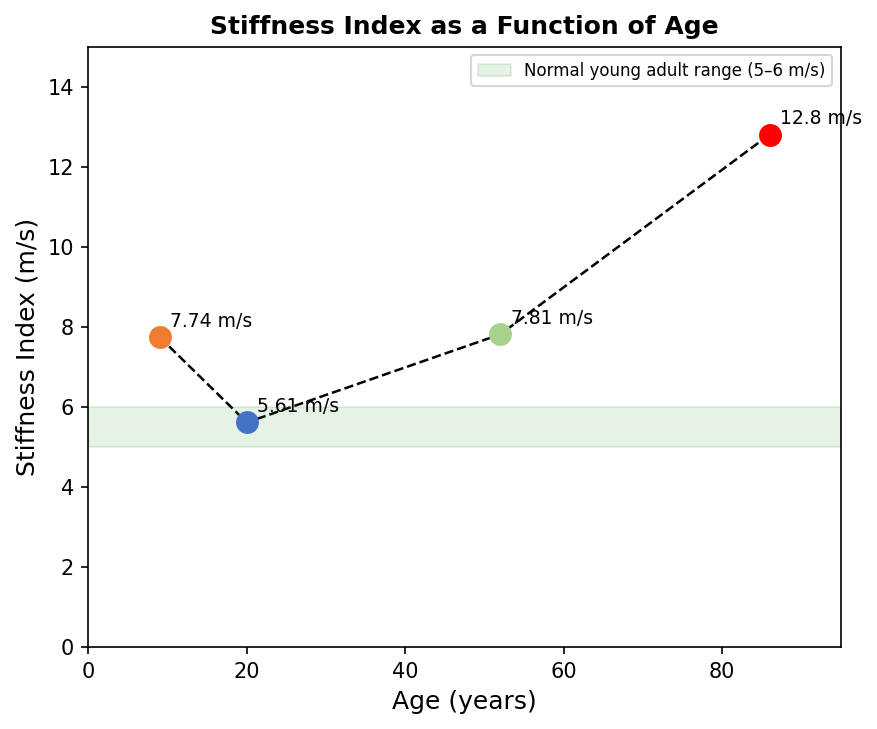
Arterial Stiffness Trajectory Across Lifespan
Continuous age trajectory mapping across subjects aged 9 to 86 years. The green shaded region depicts the clinical reference interval for healthy young adults (5–6 m/s, Millasseau et al. 2002).
Notice the accelerated compliance loss beyond the 5th decade, where medial elastin fragmentation and collagen glycation substantially accelerate large artery pulse wave velocity.
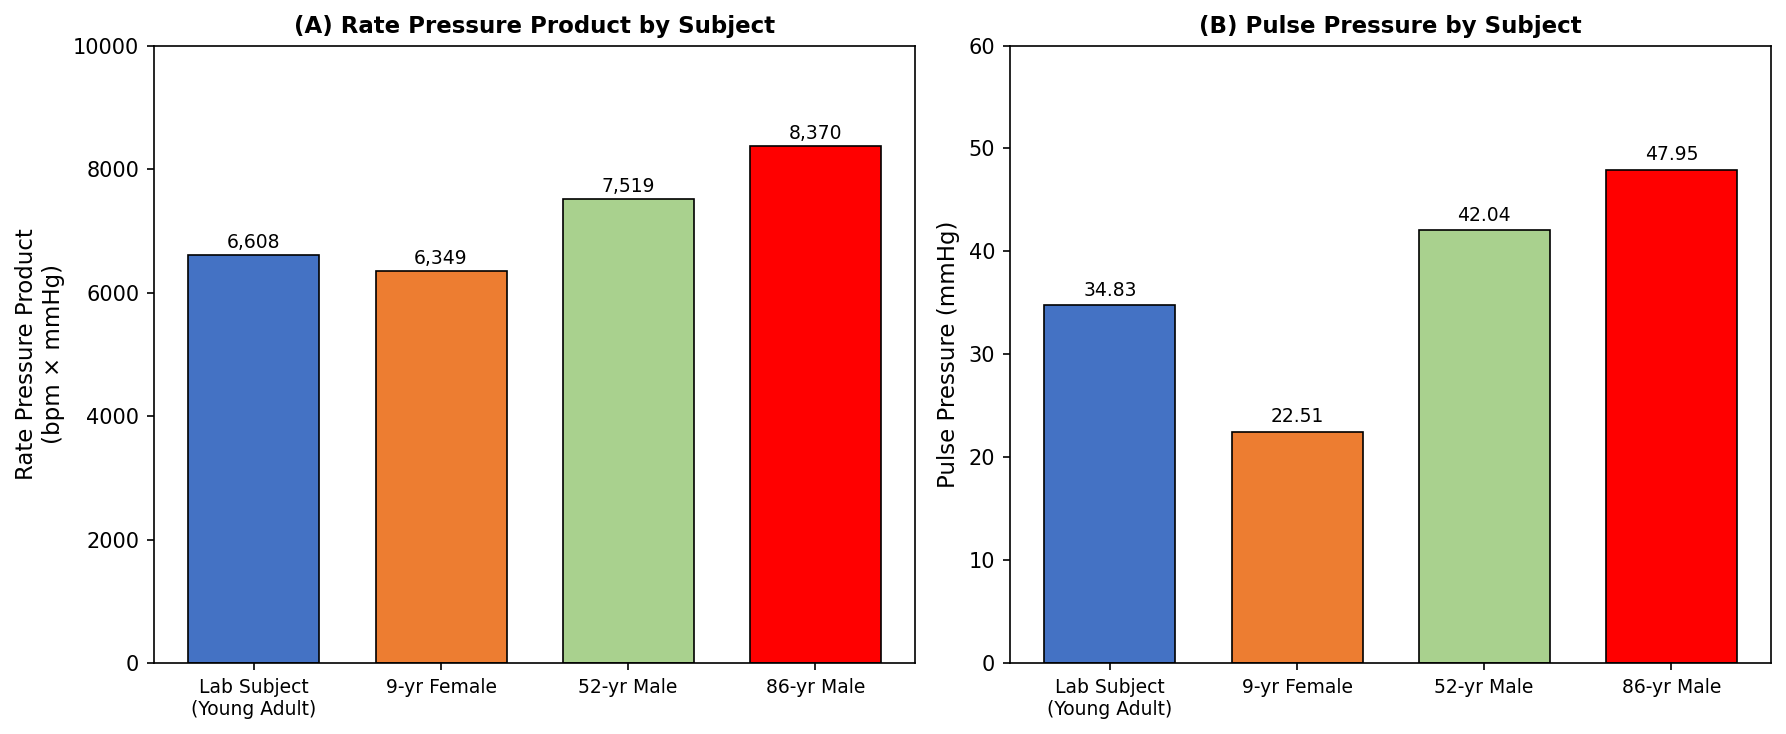
Myocardial Workload & Pulse Pressure Escalation
Panel (A) confirms that the 86-year-old heart bears the heaviest workload (RPP = 8,370), driven by elevated systolic pressure against an unyielding aorta.
Panel (B) reveals pulse pressure widening (22.5 → 47.95 mmHg) resulting directly from lost aortic Windkessel damping.
Clinical Significance in Preventative Cardiology
Early Vascular Aging (EVA) Detection
Digital pulse contour analysis is non-invasive, low-cost, and easily reproducible. It detects microstructural arterial remodeling long before overt hypertension or atherosclerotic plaques appear on ultrasound.
Decoupled Vasomotor Tone
Proved empirically that Reflection Index (RI) does not follow chronological age monotonically, as peripheral resistance is modulated dynamically by autonomic sympathetic tone and aerobic fitness level.
Wearable Point-of-Care Translation
Demonstrated that synchronizing optical PPG with single-lead biopotentials provides a viable framework for continuous, cuffless cardiovascular monitoring in modern smart wearables.